Jed Quiaoit
Samantha Himegarner
Jed Quiaoit
Samantha Himegarner
AP Biology 🧬
358 resourcesSee Units
The Hardy-Weinberg equilibrium is a theoretical model that describes how allele frequencies in a population will remain constant over time in the absence of certain influences, such as natural selection, genetic drift, mutation, and migration.
In general, The model assumes that the population is large, randomly mating, and not subject to any influences that would affect the frequency of alleles. (We'll dive deeper into these conditions later!) 🧉
Under these conditions, the frequency of alleles in the population will remain constant from generation to generation. Applications-wise, the Hardy-Weinberg equilibrium provides a baseline against which actual population data can be compared to assess whether evolution is occurring.
The Five Conditions
The Hardy-Weinberg equilibrium is a model in which allele frequencies will not change if these five conditions exist: 5️⃣
- No mutation: new alleles are not added to the gene pool, so the existing alleles are passed on to the next generation.
- No selection: no natural or artificial selection is acting on the population, so no allele is favored over another.
- No gene flow: there is no movement of individuals between populations or migration that would introduce new alleles or remove existing alleles.
- Infinite population size: the population is so large that random fluctuations in allele frequency (genetic drift) do not occur.
- Random mating: mating is completely random and not influenced by any genetic or environmental factors.
Of course, each of these five things are impossible for a natural situation. A population will never be infinite, and mutation is not something that can be controlled! That’s why this simply acts as a model to calculate genotypic ratios under these assumptions (which, of course, are false).
Calculated Ratios
The calculated ratios under this control population can serve as a null hypothesis for evolution. The allele frequencies in a population are calculated from the genotypic ratios. Here’s how:

Although this equation may look like a lot, it actually isn’t too bad. If you think about it, we only have two variables! The ‘p’ in the equations can represent the frequency of allele 1 in the population, and the ‘q’ will represent the frequency of the second allele. These numbers will be decimals, as they will represent the percentage of the population that has each phenotype (which is why it adds up to 1!). 🎆
For the first equation, p2 represents the frequency of a homozygous dominant genotype, 2pq represents the frequency of a heterozygous genotype, and q2 represents the frequency of the homozygous recessive genotype.
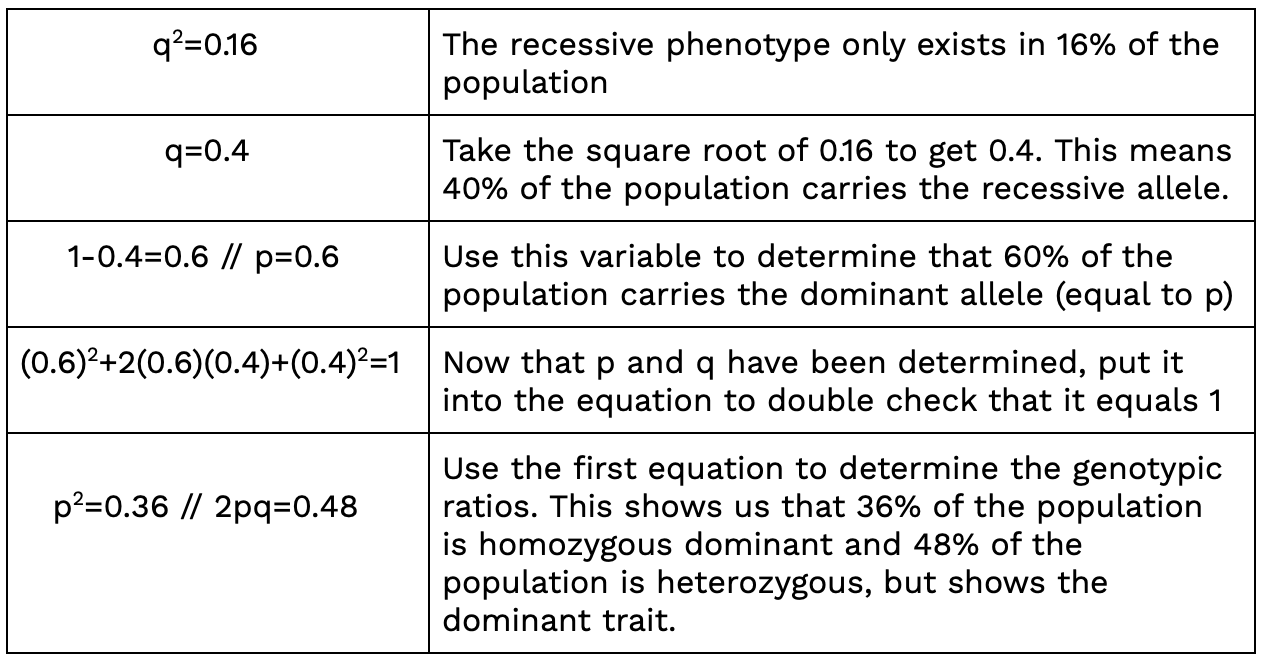
Keeping all that in mind, the first thing to do in the process of calculating is to determine the frequency of the recessive genotype. This is the only genotype that can be determined from the phenotypic ratios (a dominant phenotype could be either homozygous dominant or heterozygous).
The frequency of the recessive genotype will be equal to q2. Therefore, q can be found by taking the square root of that number. Then, subtract this number from 1 to find p, or the frequency of the dominant phenotype in a population.
Once the variable p is found, it can be put into the first equation to find the genotypic ratios of a population.

Image courtesy of Giphy.
For example, if there is a population of 100 birds, 84 of them have white feathers and 16 of them have grey feathers. Here’s how we would solve:

Example Problem
A rare genetic disorder is caused by a recessive allele, "a", in a population. The frequency of the allele in the population is 0.02. Using the Hardy-Weinberg equilibrium, calculate the frequency of the dominant allele, "A", and the frequency of individuals who are homozygous recessive (aa) and heterozygous (Aa) for the disorder. Explain how you arrived at your calculations and what assumptions of the Hardy-Weinberg equilibrium are being made in this scenario. 🍞
To solve this question, you would first assign the frequency of the recessive allele, "a", as "q" and the frequency of the dominant allele, "A", as "p". Since "A" and "a" are codominant, the sum of p and q is equal to 1.
The equation for calculating Hardy-Weinberg equilibrium is p^2 + 2pq + q^2 = 1.
We know that q = 0.02, so we can substitute that into the equation, to calculate p:
p = 1 - q = 1 - 0.02 = 0.98
The frequency of individuals who are homozygous recessive (aa) is: q^2 = 0.02^2 = 0.0004, or 0.04%.
The frequency of individuals who are heterozygous (Aa) is: 2pq = 2(0.98)(0.02) = 0.0392, or 3.92%.
With this problem, we are making the assumptions of the Hardy-Weinberg equilibrium such as:
- There is no mutation
- No selection
- No gene flow
- Infinite population size
- Random mating.
It is also good to remember that this equilibrium is theoretical and only holds true under these assumptions, real world populations almost never meet all these criteria.
Check out the AP Bio Unit 7 Replays or watch the 2021 Unit 7 Cram
Browse Study Guides By Unit
🧪Unit 1 – Chemistry of Life
🧬Unit 2 – Cell Structure & Function
🔋Unit 3 – Cellular Energetics
🦠Unit 4 – Cell Communication & Cell Cycle
👪Unit 5 – Heredity
👻Unit 6 – Gene Expression & Regulation
🦍Unit 7 – Natural Selection
🌲Unit 8 – Ecology
👏General Review
🧐Multiple Choice Questions (MCQ)
✍️Free Response Questions (FRQ)
📆Big Reviews: Finals & Exam Prep

© 2023 Fiveable Inc. All rights reserved.