2.9 International Trade and Public Policy
3 min read•december 21, 2022
dylan_black_2025
J
Jeanne Stansak
dylan_black_2025
J
Jeanne Stansak
AP Microeconomics 🤑
95 resourcesSee Units
Introduction
International trade allows all countries around the world to expand their markets and makes goods and services available to their population that might not be available domestically. International trade increases the variety of goods and services available to the population while creating a sense of competition, which in turn lowers prices for consumers.
Public policy is just simply the laws and regulations that govern economic activity. There are many trade agreements in place to govern international trade, such as NAFTA (North American Free Trade Agreement) and ASEAN (Association of Southeast Asian Nations). For example, in the United States, our largest trading partners are China, Canada, and Mexico. We participate in international trade because it is cheaper for us to trade for the goods than to produce them domestically (i.e. shoes, clothing, electronics). This guide will explain two key policies: trade quotas and tariffs.
Quotas
A quota is a government-imposed limit on production levels. This means that it limits the amount of a particular good that can come into a country from somewhere else. Quotas are used as a trade barrier in an effort to protect the domestic industries that produce similar goods.
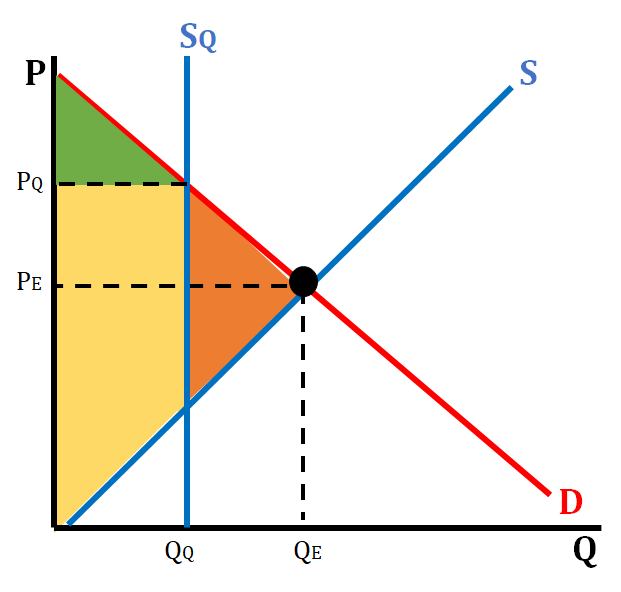
On the graph below, we see what a graph of a quota looks like. The green triangle is consumer surplus, the yellow shaded area is producer surplus and the orange triangle is deadweight loss. P_E and Q_E are the equilibrium price and quantity, respectively, before the quota. Q_Q is the quota limit on how much of the good can come into the country. P_Q is the price of the good when the quota is in effect. Sq is the imposed quota on a market. The government sets a perfectly inelastic Sq that determines exactly where the market functions.

Tariffs
Tariffs are simply a tax on a foreign good coming into a country. There are levied in an effort to reduce the amount of a particular good coming into a country by raising the price of the good.
The graphs that deal with tariffs and international trade are used to show what market price is before any international trade (closed borders), market price when there are no restrictions on trade (open borders), and market price when there are tariffs placed by the government to control the importation of certain goods and services.

The Graph Before a Tariff
Before trading, the market functions like normal, with the equilibrium price and quantity settling on QE and PE.
However, once we trade, the market changes. In the world, the price is Pw. However, this is NOT the same as a shortage! This is because all of our demand can actually be satisfied. How? Trade! The domestic market only produces Q1, but we can import Q4-Q1 to satisfy this market. At this state, consumer surplus is the monsterous triangle F-Pw-C, whereas producer surplus is the little triangle Pw-E-origin. Note that this market is entirely efficient! However, it's pretty bad for domestic producers. That's where a tariff comes in.
The Graph After a Tariff
As discussed, a tariff is a tax on a foreign good. Unlike an excise tax, a tariff simply increases what was before the world price. In the above graph, the price increases from Pw to Pt. This is still lower than the domestic price, but lesser so. Consumer surplus decreases since the price has increased, and producer surplus increases. However, there are a few more pieces. First, we see that our new quantity demanded is Q4 and our new quantity supplied is Q3. Thus, we must still import Q4 - Q3. This is taxed, so we have a rectangle of tax revenue as seen in the graph below. We also have lost consumer surplus. This is represented by the yellow triangles of deadweight loss. This is surplus that has been lost because of the tariff.
❓This graph uses some different notation. In this graph, DD and DS are short for "domestic demand" and "domestic supply". They just indicate that we're in a world economy but a domestic market!

Browse Study Guides By Unit
💸Unit 1 – Basic Economic Concepts
📈Unit 2 – Supply & Demand
🏋🏼♀️Unit 3 – Production, Cost, & the Perfect Competition Model
⛹🏼♀️Unit 4 – Imperfect Competition
💰Unit 5 – Factor Markets
🏛Unit 6 – Market Failure & the Role of Government
📝Exam Skills: FRQ/MCQ

© 2023 Fiveable Inc. All rights reserved.